Teaching with Maps

Resource for Grades 5-8

Teaching with Maps

Media Type:
Video

Running Time: 4m 41s
Size: 14.1 MB

or


Source: WGBH Educational Foundation


Resource Produced by:

WGBH Educational Foundation

Collection Developed by:

WGBH Educational Foundation

Collection Funded by:


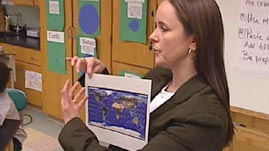
In this video segment from Teaching Earth and Space Science, middle school teacher Karen Spaulding uses GPS data on a map to help students visualize and understand how incremental changes in the positions of Earth’s tectonic plates have dramatically impacted the Earth system over the geological time scale. She introduces the lesson to help her students understand what the map represents, and the students use information derived from the map to formulate their own ideas about plate movement. The students then discuss what they learned from the activity.

open Background Essay

A common question for the teaching of science is how to concretize the abstract. However, it is easy to assume that concrete phenomena are just that—easily understood. But when students actually work with the material, it may become too overwhelming in size and scope.

In this light, abstract representations can be a benefit to students’ understanding of the topic. And by working with visuals and graphics, students can learn to master two major components of a science education—skills and content—and meet many state and national education standards in the process.

In her Earth science class shown in this video, teacher Karen Spaulding uses maps and GPS technology to translate the concept of tectonic plate motion to a format that is more easily processed by her students.

Map representations conceptualize such topics in a familiar and enjoyable form—the visual. And by translating concepts and practices between maps and content knowledge, students have the opportunity to visualize and imagine phenomena that occur on a grand scale. Even the concrete ideas students encounter may not be so self-evident, and the education of such concepts can benefit from these kinds of visualizations.


open Discussion Questions

You may find it useful to watch this video with a group of your colleagues and then discuss it together.
  • Identify two or three ways in which Spaulding established connections between concrete phenomena and the abstract representation on the map. How did the activity help these students understand processes that take place over geological time?
  • Did you notice a range of conceptual understanding and development articulated by the students?
  • Suggest a follow-up question or activity that the teacher could employ to help these students further develop their emerging understanding of processes that take place over deep time and on global scales.

open Standards

 
to:

Loading Content Loading Standards

PBS LearningMedia
Teachers' Domain is moving to PBS LearningMedia on October 15, 2013. On that date you will be automatically redirected to PBS LearningMedia when visiting Teachers' Domain.
Close PBS LearningMedia PBS LearningMedia Login