Teachers' Domain - Digital Media for the Classroom and Professional Development
User: Preview

Source: WGBH Educational Foundation


A common question for the teaching of science is how to teach scientific inquiry. Setting up a fair experiment, prediction, and observation are scientific practices that need to be instilled in students from early years so that they can progress in the sciences in the higher grades.
So how does one relate a scientific skill, approach, or perspective? Maps, graphs, and other visual representations can serve as teaching devices. If used well in the classroom, they may not only hit difficult topics home for students, but also teach scientific practices such as prediction-making.
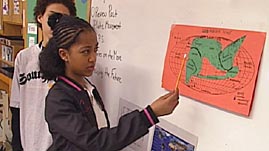
In her Earth science class shown in this video, teacher Karen Spaulding uses maps and GPS technology to translate the concept of tectonic plate motion to a format that can be more easily processed by her students. She also uses this format to get her students to learn scientific practices—making predictions about the future location of continents.
Map representations can therefore play a role in the teaching of scientific inquiry by providing a visual playground for the student’s imagination. They allow students to scale large Earth systems to a digestible size, and more generally afford students the chance to practice translating between visuals and abstract ideas.
 Loading Standards