Teachers' Domain - Digital Media for the Classroom and Professional Development
User: Preview
Global warming is a hot topic these days. But is it really relevant to you? Have you noticed changes in your surroundings that could be explained by global warming?
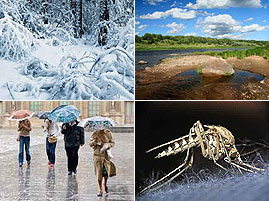
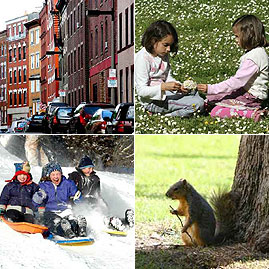
Consider the following climate indicators. Write down any changes you have personally noticed in recent years.
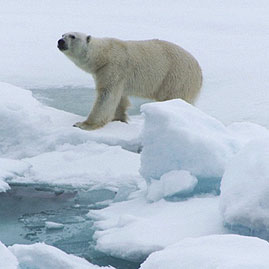
Have you heard about changes in the Arctic attributed to global warming? Write down some reasons why you might be concerned about what is happening there. For some ideas, think about recent news reports and films.

Data sets are collections of observations obtained through surveys (such as the observations by local residents) or instruments (such as satellite measurements). Scientists look for patterns within data sets to help them formulate research questions. To explore these questions, scientists often develop predictions and then design ways to test whether they are valid.
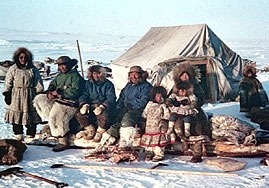
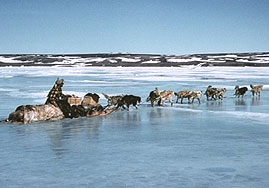
The Inuit peoples of the Arctic have been passing down climate observations from generation to generation. Their daily lives depend heavily on their natural environment, whose material resources provide them with food, clothing, and shelter. Sharing these observations is essential to the success and survival of their culture. Recently, however, their understanding of their surroundings has been challenged by observations that have no precedent in their thousand-year history.
Observed data of this type, which are not collected by instruments, are called qualitative data. Although qualitative data cannot be compared mathematically, they can be highly informative for anyone studying climate change.
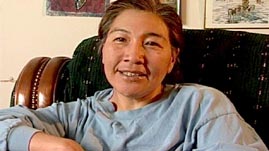
Video: 5m 48s
Sachs Harbour on Banks Island is located along the Western Arctic coast of Canada. The Inuit who live there—the Inuvialuit—have observed changing weather factors that indicate long-term climatic trends. As their climate and physical surroundings change, the Inuvialuit are finding ways to adapt and thereby protect the future of their culture.
Watch the Inuit Observations of Climate Change Video.
Jot down some of the ways that climate change is affecting the lives of the Sachs Harbour community.
Divide into pairs and watch the Inuit Observations of Climate Change a second time. As you watch, fill in the following chart based on the more detailed recorded observations and interviews of the Sachs Harbour residents.
If you prefer to do this on paper, download the PDF version of this chart (PDF).
With your partner, discuss these questions:
Before continuing, discuss with the class some of the strengths and shortcomings of qualitative data.

Video: 3m 50s
Satellite-based sensing and imaging technologies cannot record the impact that climate change has on a people's way of life, but they can provide a numerical understanding of what is happening in an area being studied. We call data that are collected by instruments and can be compared mathematically quantitative data.
Satellite observations can comprise data from multiple readings, giving scientists the ability to make broad evaluations—for example, gauging the impact of climate change over time throughout the entire Arctic region.
In the next part of this activity, you will be working with visualizations made from satellite data. As a class, begin by watching the Earth System: Satellites Video. Then, discuss the following questions:
As demonstrated in the video, data compiled using readings from sensors on board satellites can be used to create dynamic visualizations. The following is an example of an animation developed using data collected from 1979 to 2007:
Video: 0m 24s
Annual Arctic sea ice minimum (1979–2007). Overlaid graph shows the area in million square kilometers for each year's minimum day.
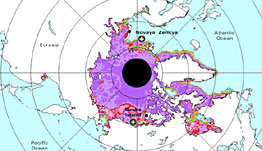
Interactive
You will now have a chance to make your own analysis of changes in Arctic sea ice using visualizations from NASA satellite data. With your partner, select one of the following questions to investigate:
Now go to the Arctic Sea Ice Satellite Observations Interactive. If you selected question 1, go to the "March 1982–2007" tab. If you selected question 2, go to the "June 1982–2007" tab. Play the animation (several times, as needed) to see how the sea ice has changed during this 25-year time span. You can also look at the individual years, and compare 1982 and 2007 using the "Show Comparison 1982 & 2007" button.
After viewing the selected animation, discuss with your partner any significant changes you observed. Then, write down your findings.
Depending on which month you focused on in the interactive activity, print out Arctic Sea Ice Map: March 1982–2007 (PDF) or Arctic Sea Ice Map: June 1982–2007 (PDF). Follow the instructions below:
March 1982–2007
Select one of the following regions:
Estimate the difference in maximum sea ice coverage between the 1982 and 2007 visualizations. The printouts will assist you in making your calculations. Count the number of grid squares covered by sea ice in your chosen region for each year, then calculate the difference between the two years. Each square represents 10,000 sq km.
June 1982–2007
Select one of the following regions:
Using the printouts to assist you, mark any
areas where you notice changes in spring
breakup of the ice between the two years.
Specifically, highlight places on either map
where ice was present in one year, but not
in the other. You can also refer back to the
Arctic Sea Ice Satellite Observations Interactive
to identify places where the ice concentration
has changed.
When you have finished, write down your findings. Does this quantitative data support or fail to support the qualitative data based on the Inuit observations?
Copy your findings to a chart in your classroom (one chart per region). Give everyone a chance to look at the different class findings, and then use the chart data as the basis for a class discussion of the following questions:
In this investigation, you will gather responses to your own class survey on climate observations in your community.
Begin by working in small groups to design a survey based on the Inuit Observations of Climate Change video and the Banks Island observations chart. Make a list of questions that might be useful to assess what your community has experienced with respect to changes in weather and, over the longer term, climate. (Note: You may refer to the Observations Chart in the next section to help you design your survey questions.)
When all of the small groups are finished, share your questions with the class. As a class, decide which ones to include in the final version and agree on a response format (e.g., a written or verbally administered questionnaire).
Finally, go out into your community and conduct the survey. Be sure to involve people of different ages to get a broader variety of observations. You should restrict your survey to people you know well, such as friends, family members, and neighbors.
Create a data set by summarizing your survey data in the table below. You can also revise the row and column headings as needed to best reflect your data set.
If you prefer to do this on paper, download the Printable Observations Chart: Your Community Document.
Based on the evidence you have collected and summarized, form a testable prediction about climate change, using the following guiding questions.
Share your prediction with the class. Also, discuss whether this activity has helped you understand why global warming and climate change has, until recently, been a controversial topic in the news.
To learn more about the Arctic, examine additional satellite data, or to explore significant atmospheric events, check out the following:
The Arctic
Earth Observations
Explore the NASA Earth Observations (NEO) Web site. Learn which weather and climate factors are being monitored from space, and develop a research question to investigate using the extensive data sets available.
Weather Effects
Consider the local, regional (e.g., Arctic), and global effects of significant atmospheric events such as a hurricane, volcano, or El Niño/La Niña. Be sure to differentiate between weather effects and climate effects. Here are some suggested Web sites on which to conduct your research:
General:
Arctic:
Pack Ice Image
© Achim Baqué - Fotolia.com
Teachers' Domain, Observations of Climate Change, published January 17, 2008, retrieved on ,
http://www.teachersdomain.org/resource/ipy07.sci.ess.watcyc.saobclimate/
Media Type:
Self-paced Lesson


National K -12 Subject:
WGBH is trying to develop materials that better meet the needs of our users. Please take this brief survey to share how you use these resources and to provide feedback on your experiences using these materials. Take the Survey!
This media-rich self-paced lesson introduces students to the various ways that people work to understand climate change, particularly in the Arctic. Scientists look for patterns within data sets to help them formulate research questions and then develop predictions that they can test. The Inuit peoples have been passing down climate observations from generation to generation. Students organize data on the observations of Sachs Harbour residents. They then think about climate change in their own community. They collect and summarize their own data, then form a testable prediction about climate change based on this data.
This is a student-directed activity. Download the Teacher's Guide: Observations of Climate Change PDF Document for essential background information and suggestions for ways to support the activity.
To help improve this service, please report and describe any standards correlations that you find to be inaccurate.
Academic standards correlations on Teachers' Domain use the Achievement Standards Network (ASN) database of state and national standards, provided to NSDL projects courtesy of JES & Co.
![]()
We assign reference terms to each statement within a standards document and to each media resource, and correlations are based upon matches of these terms for a given grade band. If a particular standards document of interest to you is not displayed yet, it most likely has not yet been processed by ASN or by Teachers' Domain. We will be adding social studies and arts correlations over the coming year, and also will be increasing the specificity of alignment.
You must be signed in to see standards matches for your state.
 Loading Standards
 Teachers' Domain is proud to be a Pathways portal to the National Science Digital Library.
Major funding for Teachers' Domain was provided by the National Science Foundation.
Teachers Domain® Home | Change Edition
About Teachers' Domain | Contact Us | Privacy Policy | Terms of Use
Teachers' Domain: © 2002-2025 WGBH Educational Foundation | shopPBS Educational Media
