Teachers' Domain - Digital Media for the Classroom and Professional Development
User: Preview

Source: NASA Goddard Space Flight Center


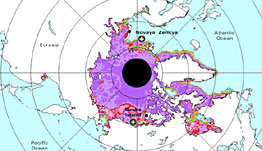
This interactive activity produced for Teachers' Domain features visualizations created from two satellite data sets—spanning 25 years—that show maximum sea ice extent and springtime breakup of sea ice in the Arctic. By analyzing long-term data, scientists can see beyond normal fluctuations and discern real trends. In this activity, users can play animations made from the visualizations and compare the state of Arctic sea ice in 2007 and 1982.
Because ice plays an important role in moderating both global atmospheric temperature and ocean circulation, climate scientists have focused much of their attention on ice conditions in the Arctic. Data from satellite observations and visualizations derived from them, bolstered by ground-level observations made by people in local communities, provide scientists with a deeper understanding of climate change and its effects on the Arctic and beyond. As a result, dozens of satellites are monitoring the Arctic.
Satellites are equipped with different types of sensors depending on the data to be collected. Weather satellites use infrared sensors to measure the temperature of clouds, which can indicate rainfall potential. In the absence of clouds, infrared sensors can measure land and ocean surface temperature. Other satellites beam microwaves or radio waves at Earth. Because these types of radiation can penetrate cloud cover and provide information in darkness, surface measurements can be taken year-round, even during severe Arctic storms and sunless winters.
Scientists now have a record of Arctic satellite data that stretches back to 1979. These data show that both the extent and thickness of sea ice and glacial ice have decreased in the Arctic in recent decades. The loss rate of sea ice—now up to 10 percent per decade—is such that summer ice could completely disappear by 2040, if not sooner. Considering that even small changes in ice volume could have a significant impact on global climate, ocean circulation patterns, and animal habitat, a dramatic change in ice volume would have an even more dramatic impact on our planet.
Although melting sea ice and glacial ice currently deposit some fresh water into the Arctic Ocean, increased precipitation is of more immediate concern to scientists. Adding fresh water from rain or snow dilutes sea water. Enough of it could conceivably prevent North Atlantic surface waters from sinking, thereby slowing or stopping the primary ocean circulation pattern known as the "Great Ocean Conveyor Belt." As ice cover retreats, more moisture evaporates into the atmosphere, which leads to more precipitation. This kind of self-perpetuating engine is what scientists call a positive feedback loop.
Given these findings and the world's interest in global climate change, long-term observations are essential to understanding Arctic climate change. As monitoring technologies improve, so do the visualizations produced. For example, higher resolution images can reveal smaller cracks and fissures in ice, a critical detail that helps scientists better understand the dynamics of springtime ice breakup.
 Loading Standards
 Teachers' Domain is proud to be a Pathways portal to the National Science Digital Library.
