Teachers' Domain - Digital Media for the Classroom and Professional Development
User: Preview

Source: NASA/Goddard Space Flight Center Scientific Visualization Studio
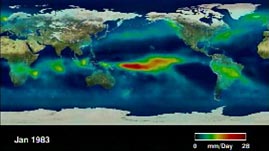
The distribution of rainfall on Earth follows clear patterns that can be traced to factors that influence cloud formation, such as the amount of solar heating, surface temperatures, topography, and proximity to moisture. In this visualization from NASA, observe the monthly distribution of global rainfall from January 1979 to January 2001, as illustrated by data gathered with a combination of remote-sensing and ground-based methods.
Rain clouds can be formed by a number of different processes, including orographic ascent, convection, and convergence. Orographic ascent takes place when the shape of the landscape forces air upward; convection occurs when air at ground level is heated by Earth's surface, becomes less dense, and then rises up through the cooler, denser air above it; and convergence happens when two air masses meet, forcing one of them upward.
No matter what process causes air to rise, as it rises, it cools. When the temperature of the air falls below the dew point, the rate at which water vapor condenses onto tiny particles in the air to form cloud droplets exceeds the rate of evaporation of liquid water. As water vapor continues to condense onto the cloud droplets, the droplets grow in size until they are too heavy to remain suspended in the air, and they then fall to the ground as precipitation, namely rain or snow.
Looking at a map of global rainfall, it is easy to notice patterns in distribution. This video shows regional differences in rainfall as well as annual variations within regions. For example, rainfall is heaviest in the tropics — areas whose latitude is less than 23.5 degrees north or south of the equator and which receive a nearly constant amount of solar energy throughout the year. Because the warmer air is the more water vapor it can hold, the equatorial region, which receives the most solar radiation and is very warm, contains extremely moist air. In addition, the northern trade winds meet the southern trade winds in this region to create the Intertropical Convergence Zone (ITCZ) — a band around Earth where moist tropical air is forced upward and heavy rain showers and frequent thunderstorms are produced. During the course of a year, the ITCZ migrates with the most direct angle of sunlight. When it is summer in the northern hemisphere, the ITCZ shifts towards the north; when it is winter in the northern hemisphere, the ITCZ shifts toward the south.
Knowing the processes that form clouds and rain, it is possible to understand why trends exist in the global distribution of rainfall. In general, it is least likely to rain where the air is very stable and there is no mechanism to lift air masses, such as in flat desert areas. Central areas of continents that are far from sources of moisture produce little rain as well. Areas with colder climates, such as the polar regions, are also unlikely to produce precipitation because the air is simply too cold to hold much moisture. By contrast, areas that have mountain ranges near large bodies of water, such as the western coast of Canada, are likely to receive quite a lot of rain.
 Loading Standards
 Teachers' Domain is proud to be a Pathways portal to the National Science Digital Library.
