Teachers' Domain - Digital Media for the Classroom and Professional Development
User: Preview

Source: Northeast Historic Film, WCVB Collection
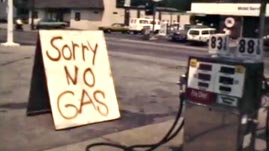
This archival news footage from Northeast Historic Film shows scenes of gas stations during the 1979 oil crisis. When operating, the gas stations faced long lines of cars that one customer suggested stretched about a half-mile long. When the stations were closed, signs in front reflected the country’s supply shortage at the time—for example, “Our pumps are closed” and “No gas.” A station owner explains that regulating hours of operation was necessary to keep stations open throughout the month. An attendant blames “the papers” for causing customers to panic.
This video is primary source footage and has not been extensively edited.
In the 1970s, events in the Middle East led to widespread crude oil supply interruptions on two occasions. In 1973, Arab oil-exporting nations stopped selling oil to countries that supported Israel in the Yom Kippur War. Then in 1979, following an oil-workers strike that shut down production, Iranian revolutionaries chased the ruling shah from power. The consequences of these interruptions to American consumers were similar both times. As the supply of imported oil dropped, the lines outside gas stations grew longer, and the prices consumers paid climbed higher.
Political realities are widely blamed for triggering the 1979 oil crisis. The events in Iran were, in fact, responsible for a sharp decrease in petroleum production that began at the end of 1978. Before a new regime came to power in March of 1979, the country had ceased exports completely. At this time, Iran was the world’s second-leading petroleum producer, so as a result of the supply cut—and following the basic rule of supply and demand—the price of oil and any products made from it could naturally be expected to rise.
During the 1979 crisis, many Americans began to blame the oil companies—and not just political factors outside the country’s control—for artificially creating the supply shortages that drove up prices. After all, the volume of oil sold in the U.S. in 1979 turned out to be only slightly less than the year before. Analysts who have since studied the crisis have found that the government may have held a greater share of the responsibility.
The U.S. Department of Energy incorrectly anticipated the availability of crude oil for the year. The forecast of a supply shortage likely encouraged some distributors to start stockpiling oil to maintain a supply that would last rather than selling it immediately to service stations. If gasoline had continued to reach the stations at close to normal volume, consumer prices would have risen less significantly—and there would have likely been less panicky behavior, like that shown in the news footage.
In responding to the unfolding crisis, President Carter announced a plan to lift controls on the price that suppliers could charge for domestic oil. These restrictions had been put in place during the previous crisis and were designed to keep the overall price that consumers paid for oil-based products lower, especially in times of shortage. Carter had hoped that lifting price controls would encourage more domestic production to make up for what was being lost in imports. But his decision to place a new tax on domestic oil companies largely killed their incentive to produce more, so only prices rose.
In April, before the impact of the Iranian oil supply disruption was felt, the average price of crude oil was $15.85 per barrel. Over the next 12 months, it rose to $39.50 per barrel—an even sharper increase than had occurred during the 1973 oil crisis.
Here are suggested ways to engage students with this video and with activities related to this topic.
Divide the class into small groups. First, have students consider the cars shown in the footage and answer these questions: What kinds of cars were on the road in 1979? How did their sizes compare to cars today? When the gas station attendant told his story, he referred to a Cadillac as a big car. What would he use as an example in 2012? He also blamed the frenzy around gas prices to “the papers.” What word or phrase might he more likely use today?
After students answer these questions, have them compare the average price of gas in 1979 to what it is today. Ask them, Why are prices higher now than in 1979? Are we in an oil crisis? Also ask, Do you think gas prices can be, or should be, brought down? If so, how?
In the news footage, students can see the prices of two items for sale: gas and Coke. While it may not be evident what quantity of Coke could be bought for $4.99, the price of 83.9 cents for a gallon of regular gas is clear. To help students understand the relationship between the prices of these items in relation to a worker’s income, and how much of an impact changes to them might have, ask them to do some research.
First, have students research what the price of gas and Coke meant in 1979. How much, if at all, had they risen in the previous two years? Then have them find out what an average worker’s income was in 1979 and relate these prices to weekly salaries. Finally, have them make the same determinations for today.
 Loading Standards